Sales Summary Report
Get a daily breakdown of sales, returns, net sales, VAT, and profit for any date range across all your branches.
What You'll Learn
- How to open and filter the Sales Summary report
- What each column in the report means
- How to export the report to a spreadsheet
Before You Begin
- You need access to the Reports section (owner or manager with Reports permission)
Step 1: Go to Reports > Sales Summary
From the left sidebar, click Reports, then click Sales Summary.
Step 2: Set the Date Range
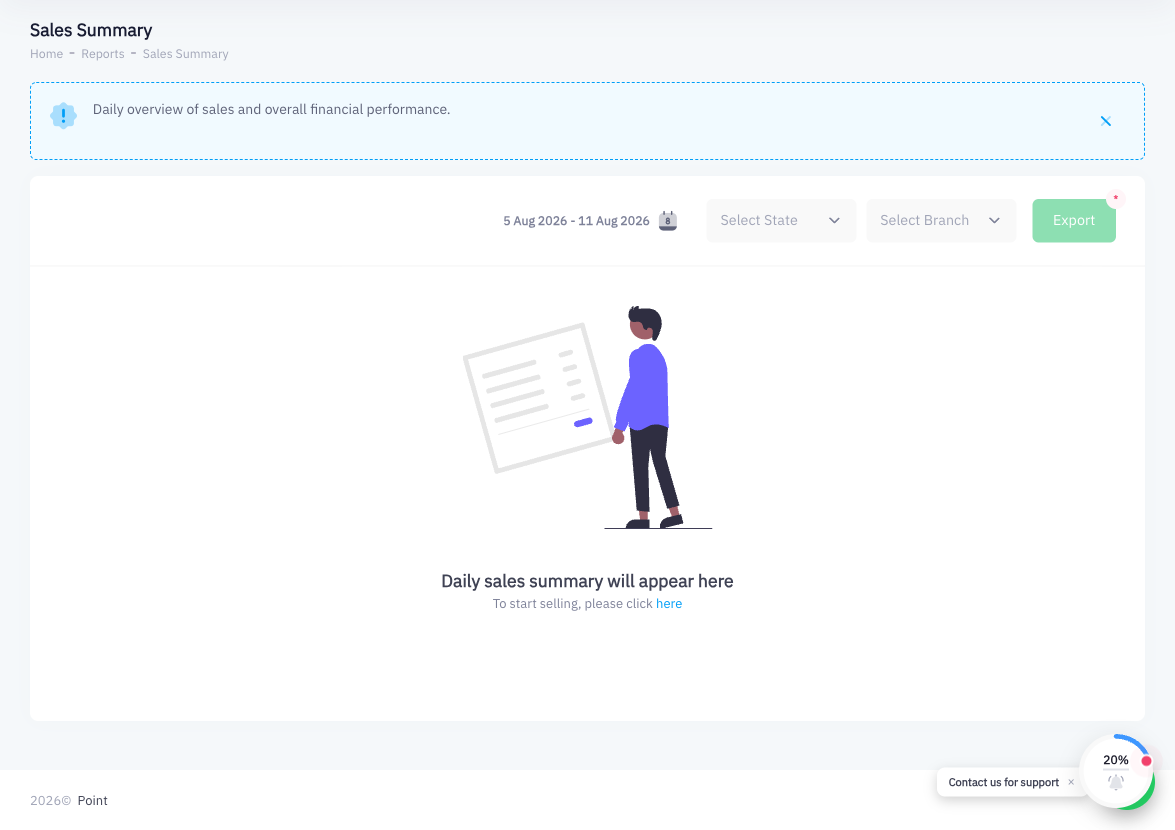
Use the date range picker at the top right of the page to select the period you want to analyze. Click the start date, then the end date, and confirm.
Step 3: Filter by Branch
Click the All Branches dropdown to filter results to a specific branch. Leave it as "All Branches" to see combined totals across your entire business.
Step 4: Filter by Register State
Click the All States dropdown to filter by register state (open, closed, etc.). This is useful for isolating specific register sessions.
Step 5: Review the Report Table
The report displays one row per day. The columns are:
| Column | Description |
|---|---|
| Date | The calendar date |
| Sales | Total gross sales for the day |
| Returns | Total value of returns processed |
| Net Sales | Sales minus Returns |
| VAT | Total VAT collected |
| Net Profit | Net sales after cost of goods |
| Transactions | Number of individual invoices |
Step 6: Click Export
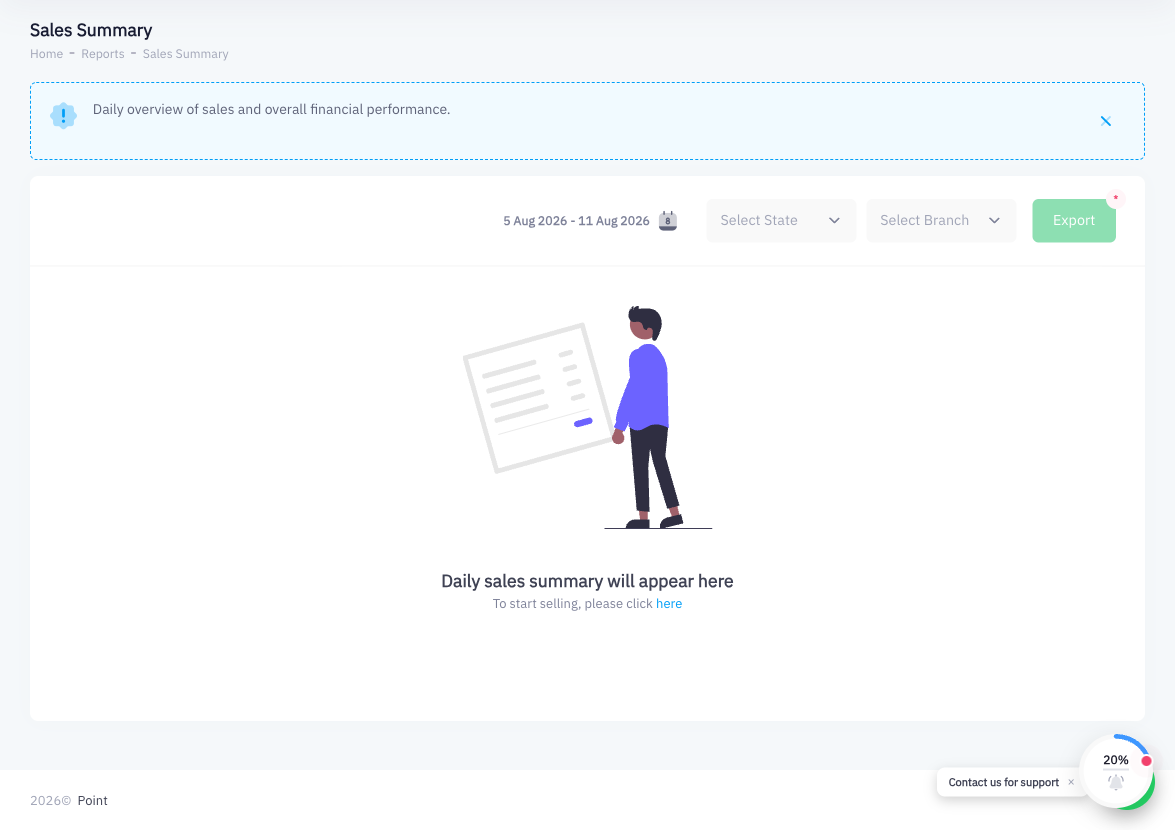
Click the Export button to download the report as a spreadsheet file. The export includes all rows matching your current filters.
Summary
The Sales Summary report gives you a day-by-day financial overview for any date range. Use the branch and register state filters to drill into specific locations or sessions. The table shows gross sales, returns, net sales, VAT, net profit, and transaction count — giving you everything you need for a quick business health check or accountant handoff. Use Export to share the data outside of Point.