Product Sales Mix Report
Identify your best-selling products, track return rates, and analyze profit margins at the product level.
What You'll Learn
- How to open the Sales by Product report
- How to filter by date range and branch
- How to export product-level sales data
Before You Begin
- You need access to the Reports section (owner or manager with Reports permission)
Step 1: Go to Reports > Sales by Product
From the left sidebar, click Reports, then click Sales by Product.
Step 2: Set the Date Range
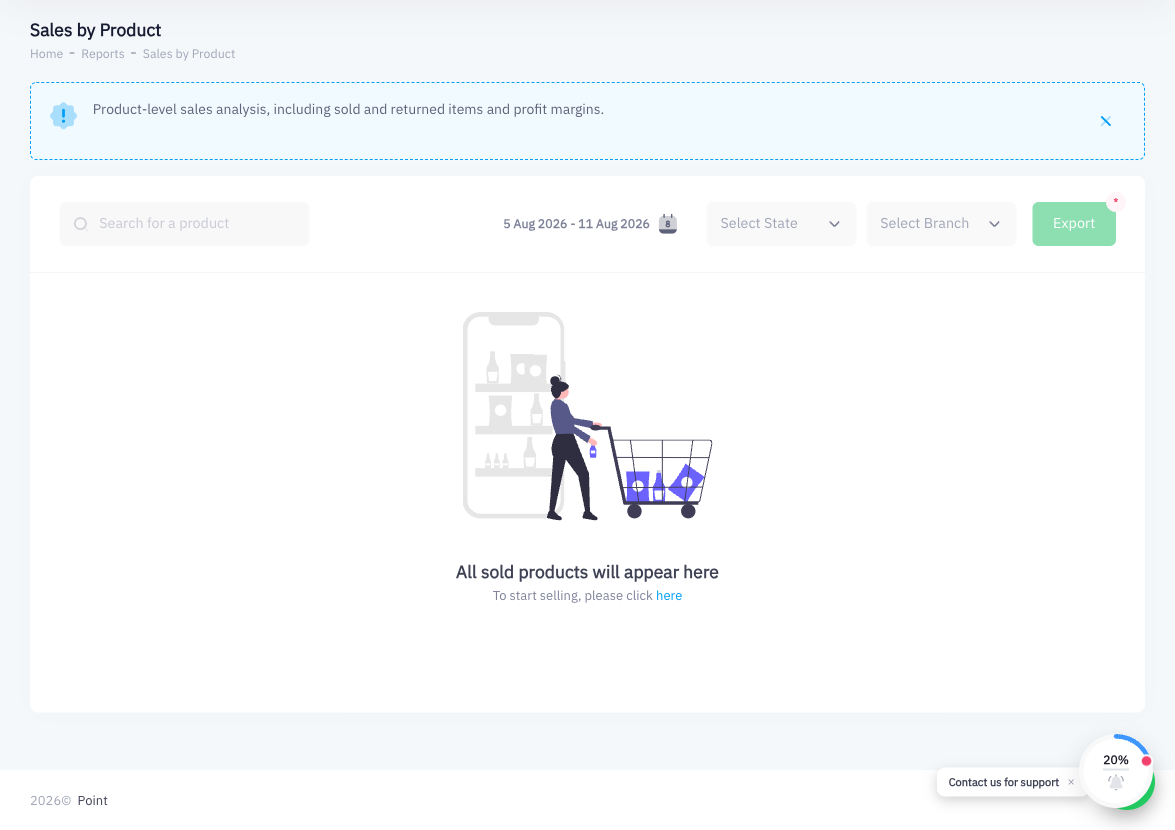
Use the date range picker to select the period you want to analyze. Narrowing the date range to a week or month makes it easier to spot trending products.
Step 3: Filter by Branch
Click the All Branches dropdown to restrict the report to a specific location, or leave it at "All Branches" for a business-wide view.
Step 4: Review Products Ranked by Sales Volume
The report lists each product as a row, ranked by total sales. Use this view to:
- Identify your top-selling products
- Spot products with high return rates
- Compare profit margins across the catalog
Step 5: Export
Click Export to download the report as a spreadsheet. The export is useful for sharing with buyers, reviewing inventory orders, or preparing category performance summaries.
Summary
The Sales by Product report gives you product-level visibility into your sales performance. It ranks products by sales volume and surfaces return rates and profit margins so you can make data-driven decisions about your product mix — what to stock more of, what to discount, and what to discontinue.